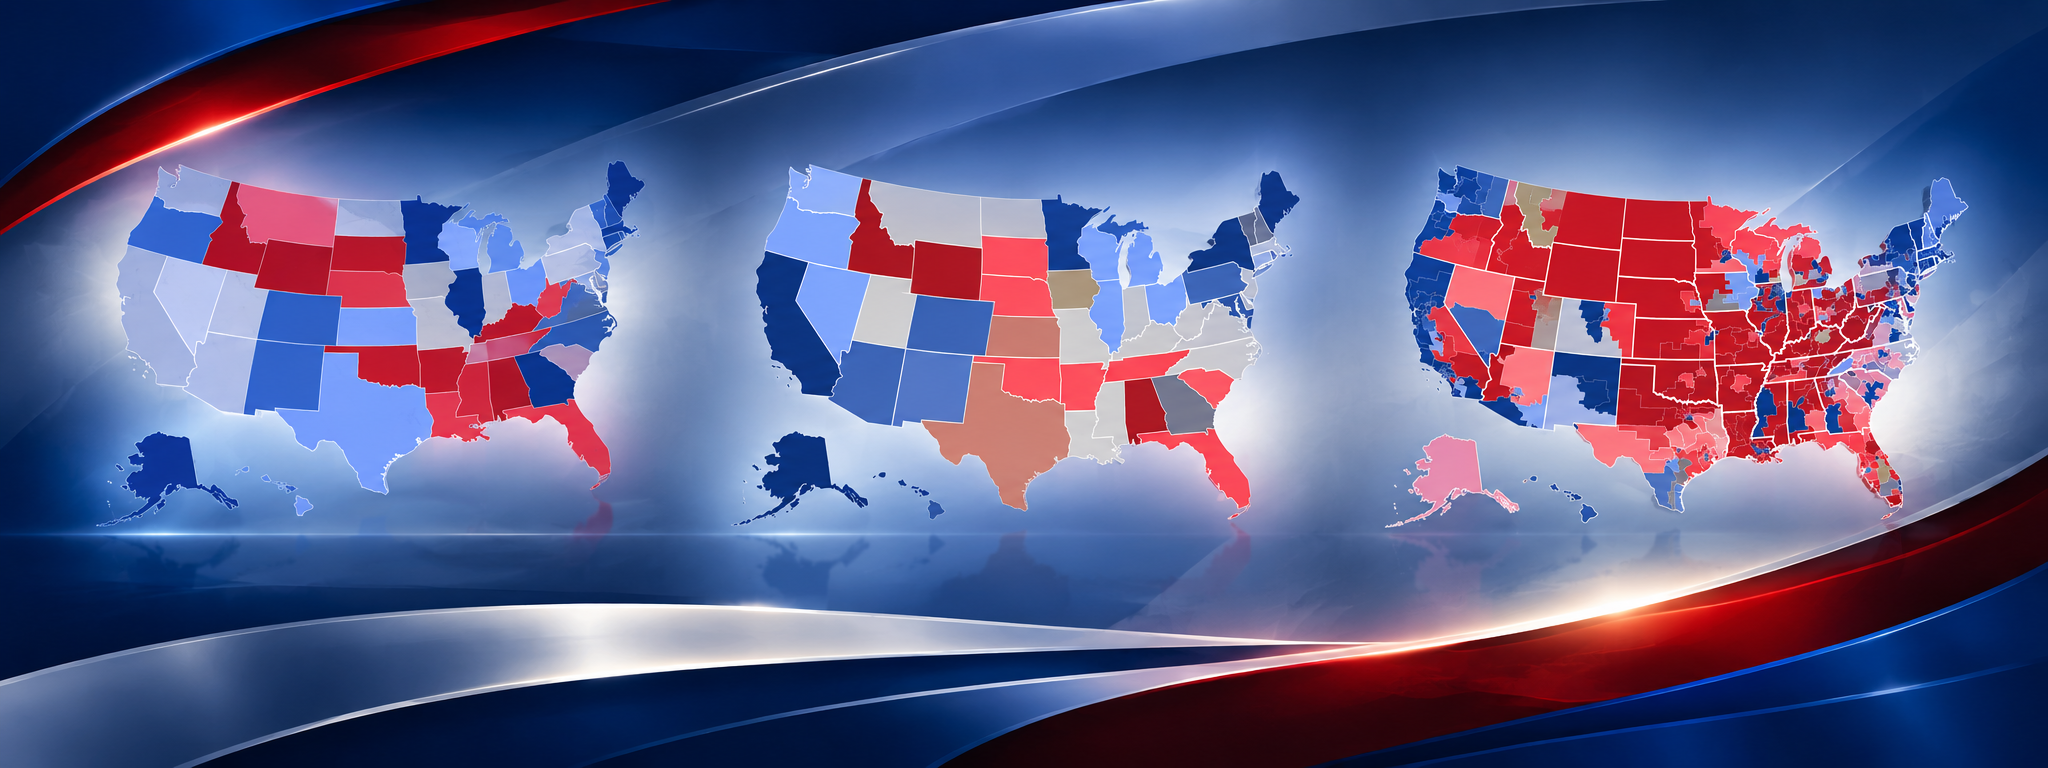

My 2026 midterm forecast is finalized.
Projected outcomes:
Senate: Democrats 53 – Republicans 46

Governors: Democrats 28 – Republicans 22

House: Democrats 234 – Republicans 192 (the rest remain undetermined)

Major upsets I’m calling
Senate
- Adam Hamilton (D-KS)
- James Talarico (D-TX)
- Sherrod Brown (D-OH)
- Mary Peltola (D-AK)
- Troy Jackson (D-ME)
Governor
- Amy Acton (D-OH)
- Keisha Lance Bottoms (D-GA)
- Aaron Ford (D-NV)
House
(The map is Democratic-leaning overall; the biggest individual flips I’m projecting are in the competitive districts in AZ, IA, MI, OH, PA, and TX)
These flips are driven by a clear Democratic advantage on the generic ballot and low presidential approval.
The method was a consistent six-factor model (polling, national environment, turnout, candidate quality, fundamentals, late developments) converted to win probabilities. This is published below.
The Eagle Eye 2026 Midterm Election Forecasting Methodology
How We Evaluate the Races, Select Our Candidates, and Assign Win Probabilities
The purpose of The Eagle Eye’s 2026 Midterm Election Forecast is not simply to repeat the prevailing political consensus. It is to make an independent, evidence-based assessment of every contested congressional and gubernatorial race, identify the candidate we believe is best positioned to win, and communicate how confident we are in that assessment.
Our forecast covers the 435 seats in the United States House of Representatives, 35 United States Senate races, and 36 gubernatorial contests. Every race is evaluated individually. We do not assume that a national political trend will affect every state or district equally, nor do we assume that a candidate’s party affiliation alone determines the outcome.
The process has two distinct responsibilities: selecting our candidate in each race and determining the probability that our selected candidate will win. These responsibilities are related, but they are not interchangeable. A forecast pick is our editorial judgment about the outcome; its probability communicates the degree of confidence the available evidence supports. We do not change a winner simply to make the probability fit a preferred rating category, and we do not inflate a percentage to make an existing pick look stronger.
Six Factors Behind Every Forecast
Our evaluations use six principal factors. The percentages below represent the relative weight assigned to each area in our overall assessment. They are a structured editorial framework, not a claim that a statistically trained equation can eliminate judgment or uncertainty.
| Factor | Weight |
|---|---|
| Polling and polling quality | 25% |
| National political environment | 20% |
| Turnout and voter enthusiasm | 20% |
| Candidate and campaign strength | 15% |
| State and district fundamentals | 15% |
| Late developments | 5% |
| Total | 100% |
1. Polling and polling quality — 25%
Polling is an important measure of voter preference, but not every poll deserves equal consideration. We examine the field dates, sample size, population surveyed, likely-voter screening, sampling method, collection mode, demographic and political weighting, sponsorship, question wording, and the pollster’s available record.
We give particular attention to the work of Mark Mitchell and The Honest Poll, and Rich Baris and BIG DATA POLL, whose research and polling have been central to our examination of the political environment. Their findings are considered alongside other available public polling. Preference for a particular pollster does not mean accepting every result without scrutiny. Each release must be evaluated on its own methodology and relevance to the electorate being measured.
Recent, well-designed likely-voter surveys generally deserve more consideration than older surveys or broad samples of adults. Repeated releases from the same pollster should not be mistaken for independent confirmation, and campaign-sponsored surveys should be examined with appropriate caution. Where polling is sparse, particularly in individual House districts, we place greater emphasis on the other factors rather than manufacture confidence from insufficient data.
2. National political environment — 20%
Elections do not take place in isolation. The national mood influences the political conditions in which individual candidates compete. We consider the generic congressional ballot, presidential approval and disapproval, the political standing of the party in the White House, and the broader economic and national circumstances affecting voters.
Economic considerations include the cost of living, inflation, employment, consumer confidence, and voters’ perceptions of their financial circumstances. These indicators are not treated as automatic predictors of an election. Their importance depends on whether they appear to be influencing voter attitudes and whether those attitudes are reflected in credible polling and other evidence.
A national advantage for one party creates a political environment that can help its candidates, but it does not erase local political realities. A strong incumbent or an unusually competitive candidate may perform differently from the national trend.
3. Turnout and voter enthusiasm — 20%
Election outcomes depend not only on what voters prefer, but on which voters actually participate. We therefore examine turnout history, voter registration, primary participation, campaign enthusiasm, demographic participation, early-voting information, and the ability of each campaign to mobilize its supporters.
Early-voting figures require particular care. Raw ballot totals do not necessarily reveal how voters will cast their ballots, and partisan registration does not establish partisan vote choice. Early-voting information is most useful when compared with historical turnout patterns and the electorate a forecast reasonably expects to participate.
We look for evidence of durable enthusiasm and organizational strength rather than treating a temporary surge in attention or a single turnout statistic as decisive.
4. Candidate and campaign strength — 15%
The quality of a candidate and the effectiveness of a campaign can substantially change the character of a race. We evaluate incumbency, public recognition, experience, political record, fundraising, organization, campaign execution, vulnerabilities, and the candidate’s ability to appeal beyond the party’s strongest supporters.
These considerations are especially important in states and districts where ticket-splitting remains possible. A candidate may be better positioned than the partisan lean of the area alone would suggest. Conversely, a candidate running in favorable territory can still underperform through weak campaigning, poor public standing, or an inability to connect with voters.
Fundraising is considered as an indicator of resources and organization, not as a substitute for public support.
5. State and district fundamentals — 15%
Every race has a political foundation that exists before the latest poll is released. We examine partisan voting history, presidential results, previous congressional and statewide elections, the Cook Partisan Voting Index where applicable, incumbency, district boundaries, and the political character of the electorate.
For House races, the actual district lines in effect for the 2026 election are essential. Redistricting can materially change the electorate and make older district comparisons less reliable. For Senate and gubernatorial contests, statewide political history provides a starting point, but a candidate’s own performance and the nature of the office must also be considered.
Fundamentals establish the baseline. They should not be mistaken for a verdict.
6. Late developments — 5%
The final stage accounts for meaningful developments that may not yet be fully reflected in established polling or other parts of the forecast. These can include new credible surveys, significant campaign events, major candidate controversies, changes in ballot access, court decisions, and substantiated developments affecting the electorate.
This factor is intentionally limited. A dramatic headline, viral social-media post, or unsupported political claim does not justify a major change in a forecast. Late developments matter when there is credible evidence that they could influence voting behavior or the administration of the election.
Comparing Forecasts Without Surrendering Our Judgment
In addition to our examination of individual polling and election fundamentals, we compare our assessments with other forecasting organizations and analysts. Our research has included On Point Politics, Dave Manuel, Polling Forecast, Sabato’s Crystal Ball, and other relevant election analyses. We also examine prediction-market information, including Polymarket, as a supplementary indication of market expectations where meaningful information is available.
These sources use different approaches. Some emphasize polling averages and fundamentals, others use district-level models or simulations, and expert ratings rely on qualitative assessments of individual races. Their estimates are valuable checks on our own conclusions, but they are not automatically interchangeable.
A model that gives a candidate a high probability does not establish that the candidate deserves the same probability in our forecast. We examine the assumptions behind its conclusion, the quality of its inputs, its treatment of uncertainty, and any known limitations. We also recognize that several forecasting organizations may rely on overlapping polls or the same underlying data. Their agreement therefore does not necessarily represent several independent confirmations.
Prediction markets are treated as another reference point, not as a replacement for polling or political analysis. Market prices can reflect changing expectations, but liquidity, trading volume, and the possibility of sharp movements must be considered before assigning significance to them.
The objective is to learn from the available research while retaining an independent forecast.
Assigning Win Probabilities
After evaluating the six factors and comparing the results with outside research, we assign a probability of victory to our selected candidate in each race.
This percentage represents our estimated chance that the candidate will win. It does not represent the percentage of votes the candidate is expected to receive, a predicted margin of victory, or the margin of error of an individual poll.
For example, a candidate assigned a 70% probability is being assessed as more likely than not to win, while still carrying a meaningful possibility of defeat. A 90% probability represents a substantially stronger assessment, but it is not certainty. A 55% probability indicates a narrow advantage and a race in which an upset remains entirely plausible.
We use whole-number percentages rather than unnecessary decimal precision. We do not force races into arbitrary probability categories or assume that every race labeled safe by an outside rating deserves a particular numerical probability. The strength of the evidence, the amount of uncertainty, and the possibility of an unexpected outcome determine the percentage.
Polling margin of error and forecast uncertainty must also remain distinct. A poll’s margin of error describes sampling uncertainty under its stated assumptions. Our win probability must account for a much broader range of uncertainty, including polling error, turnout differences, candidate performance, local conditions, and the possibility that the national environment has been misjudged.
Most importantly, we do not manipulate probabilities to protect our picks. If the evidence indicates that a selected candidate is vulnerable, the percentage must reflect that vulnerability. If an existing pick receives a probability below 50%, we retain the original selection when applying our established picks, but we disclose that the evidence places that candidate behind in the probability assessment. Accuracy and transparency take precedence over appearances.
Ranking the Races
Within each office, candidates are ranked from the highest estimated probability of victory to the lowest. The House, Senate, and gubernatorial rankings are presented separately so readers can compare the relative strength of the forecasts within each category.
This arrangement gives the audience a practical picture of where our confidence is strongest, which contests are genuinely competitive, and where the greatest uncertainty remains. It also makes clear that two candidates who share the same party affiliation may have very different prospects depending on their state, district, opponent, and campaign.
The rankings are not an alphabetical directory or a partisan seat projection. They are an ordered assessment of individual candidates and their estimated chances of winning.
Our Standard
The Eagle Eye’s forecasting method is built on evidence, independent judgment, and a willingness to acknowledge uncertainty. No pollster, forecasting model, prediction market, political party, or individual analyst receives the final word. Every source must be weighed according to what it can reliably tell us.
Our goal is not to manufacture certainty or to produce the most dramatic prediction. It is to identify the most defensible outcome in every race, assign a probability that reflects the available evidence, and explain where our confidence is strong and where it is limited.
We recognize that even a well-supported forecast can be wrong. An election is decided by voters, not by a spreadsheet, a poll, or a forecasting model. Probability is a way of measuring uncertainty—not a guarantee of the result.
The Eagle Eye 2026 Midterm Election Forecast is therefore an independent assessment of every race, grounded in polling, political conditions, turnout, candidates, and historical fundamentals, with each existing pick evaluated on its own merits and every probability assigned according to the evidence.
You must be logged in to post a comment.